Excel Masters
Excel is the most widely used financial business application. It is so versatile and easy to use up to a certain level. This problem is extracting all that data into useful information. You have sheets for employees, hours, jobs, contracts, sales, products, locations, and calendars, you get what I mean. What good is that all data if you can't use it to make business decisions that can create more profit, more sales, or see where you're losing money? Can you just scan through dozens and maybe hundreds of spreadsheets to analyze and correlate all that information?
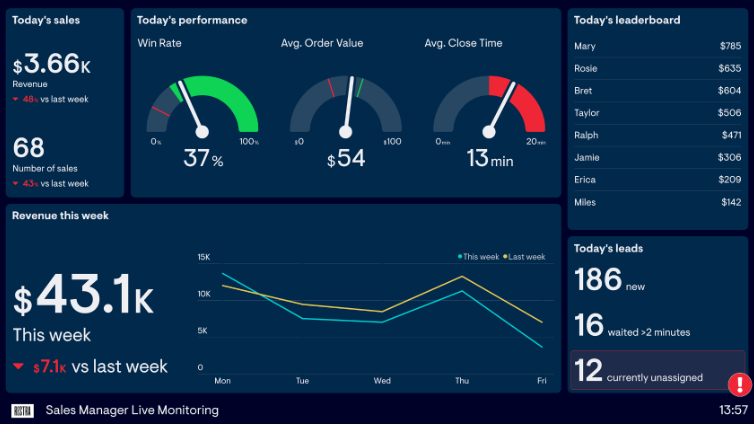
That's where we step in. It's called data visualization. We turn all that data into visual, granular info on a dashboard. For something that is interactive, click on a product and crosslink it with a different location or salespeople, by day, by week, monthly, or live dynamic numbers.
Our name says it all Data Cube. Stack 100 different spreadsheets and it creates a block. With the right knowledge and software, you can now slice and dice, comparing two salespeople selling the same product, during the same week in three different regions. Tonight you can check the sales of three different products in two stores and who sold them, TODAY. That's the power of Business Intelligence.

