
Solutions to Business Issues
Problems facing many businesses today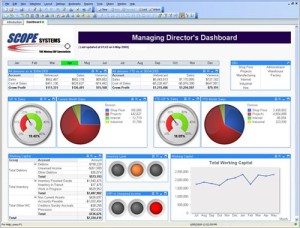
Here is a short non-inclusive list of some of the problems we see businesses being faced with. Most of these can be almost eliminated by a well-implemented Business Intelligence solution. See how many you can recognize from your current enterprise:
- Getting access to an overview of our company’s data takes many employees many hours if not days to prepare.
- When I get reports from our various departments I sometimes doubt their accuracy as I see conflicting data or conclusions.
- Only a small subset of our company has the authority, training, or skills to analyze our company’s data, even when its relevant to a particular department.
- Sometimes, different groups within our company are unclear about our current corporate strategy, and we have no accurate way to measure the results of the strategy anyway.
- Where data analysis is taking place in our organization, it is being done using different software accessing different systems and has been developed by the various departments independently.
- Our company spends a lot of time and effort gathering data to produce reports on a regular basis.
- Our CEO relies on his direct reports to gain knowledge about the performance of the various departments of the company.
- We don’t know a great deal of information about our existing customers.
- We have some kind of data warehouse already which we have seen benefits from but we have yet to do any data mining.
Solutions from a great Business Intelligence deploymentThe easy solution to most of these problems is to implement some kind of Business Intelligence in your organization. The objectives of a comprehensive Business Intelligence solution are as follows:
- Build a single set of data representing an accumulation of all relevant data stored within your organization
- Define which department needs to see which data in which format. Reports, dashboards, email, intranet, mobile.
- Establish security and access roles for employees, groups and departments.
- Build data perspectives, reports, dashboards and other user interfaces accessible by appropriate groups.
To find out more about Business Intelligence in general, please see our Learning Pages.
Phased approach = Phased expense
We recommend a phased approach to your deployment of BI This allows you to incrementally invest whilst at the same time starting to reap the rewards. For example:
- Start with one department, such as Sales or HR, and add departments of data as you start to reap the benefits of Business Intelligence.
- Have access to the raw data which can be manipulated in Excel or Report Builder before all your custom ideal reports and dashboards are completed.
- Become proficient in the concepts of BI during the implementation phase so that you can further customize the exact requirements of your final product.
Solutions for every department
Ultimately, Business Intelligence can add value to almost every area of your enterprise. Here are just some of the ways certain departments might benefit:
| Sales and Marketing |
|
Finance |
|
| Human Resources |
|
Operations |
|
| Customers |
|
User interface – Dashboards |
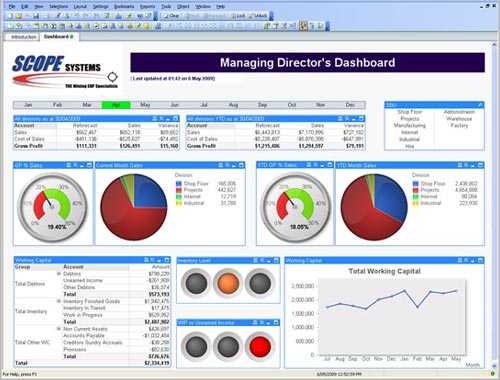
Business Intelligence solutions are only as good as the user interfaces allowing you to access and visualize the data that has been gathered. A dashboard is a user interface system targeted at executives which is similar to a car’s dashboard in that it contains a variety of the most needed information and is easy to read. Also, like a car dashboard, it is broken up into areas or blocks with each block designed to monitor a specific business process or metric. Many of these parts are graphical, like graphs and gauges. Other parts are textual but with maybe some color highlighting representing a trend of some kind. The blocks are usually in a graphical format like a gauge, indicator or chart, but some blocks contain text with color highlighting. Dashboards allow managers to monitor departments and key metrics without having to ask anyone for data or a report and allow:
- Performance measures to be represented visually
- Negative trend detection for speedy resolution
- More accurate, up-to-the-minute data for informed decision-making
- Managers and executives to easily spot efficiencies and inefficiencies
- Ability to identify new trends
- See key data from multiple reports
- Make sure corporate strategies and goals are being followed.
User interface – Reporting
- Another Business Intelligence user interface is the reporting suite of products. Reporting has been around for decades when it was purely paper-based. It has typically been used throughout the information age as a tool for management to understand their business. However, combined with Business Intelligence technology you get :
-
- One consistent set of data across the whole organization
- Extremely fast access and querying, compared with a more traditional SQL report
- Ability to run pre-defined reports on a scheduled or ad-hoc basis and have them published to web servers or auto-emailed, or become a mini part on a corporate dashboard.
- Show complex graphical representations of data
Have interactivity which allows jumping and drilling down on particular parts of a report
- Less skilled, non-technical employees can generate completely new custom reports.
Data Cube’s # 2 Solutions
Data Cube does offer a unique BI service. Many small businesses find that a full BI department is beyond their means. . BI is an expensive solution, even though the ROI far outweighs the investment it’s still a large investment that many just can’t afford.<p>
Data Cube as a solution, we provide these customers with remote Business Intelligence (outsourcing). We access their data on a regular basis, daily, weekly, and monthly as required and produce their Business Intelligence which we deliver in multiple formats such as Excel, PDF or through a web portal or Dashboard.<p>
With today’s cloud services and SAAS where the user pays a nominal monthly fee for use of the software but can’t afford the ongoing design, programming, support, and training Data Cube inc becomes your personal IS department. No different than calling your BI department down the hall and chances are we will deliver faster and certainly at a much more affordable cost not to mention that it’s trouble-free, and design and delivery are now responsibility.